


Research Article - Journal of Contemporary Medical Education (2023)
Improving the Evaluation of Primary Care Physician Accessibility in Eastern Quebec: Incorporating the Pampalon Deprivation Index into the Enhanced Two-Step Floating Catchment Area Methodology
Christian Simoneau*Christian Simoneau, Department of Societies, Territories and Development, University of Quebec at Rimouski, Quebec, Canada, Email: Johnroy@gmail.com
Received: 03-Oct-2023, Manuscript No. JCMEDU-23-115550; Editor assigned: 09-Oct-2023, Pre QC No. JCMEDU-23-115550 (PQ); Reviewed: 23-Oct-2023, QC No. JCMEDU-23-115550; Revised: 30-Oct-2023, Manuscript No. JCMEDU-23-115550 (R); Published: 06-Nov-2023
Abstract
Objective: To improve the Enhanced Two-Step Floating Catchment Area (E2SFCA) method by incorporating the Pampalon Deprivation Index (PDI). This integration will enable the characterization of the local environment and the identification of primary care accessibility patterns in Eastern Quebec that may not be detected by traditional physician access measures.
Methods: We used the Pampalon Deprivation Index (PDI) to adjust the access ratio of Primary Care Physicians (PCPs) calculated by the enhanced two-step floating catchment area method. This approach considers the supply of PCPs at the dissemination area level, travel time between PCPs and dissemination areas and a linear distance decay function (β) in conjunction with the PDI for each dissemination area. The PDI is a composite measure of material and social deprivation, which can help to identify vulnerable populations who may face barriers to accessing healthcare services.
Results: The E2SFCA method with the PDI adjustment (E2SFCA-PDI) can identify underserved areas that may appear to have sufficient access levels when evaluated using the E2SFCA method alone. The accessibility of primary care services depends on the availability of adequate road infrastructure. Populations living in areas with limited access to main road networks may have compromised access to primary care. This issue disproportionately affects vulnerable individuals who lack private transportation options.
Conclusion: The E2SFCA-PDI method can improve the identification of primary care physician shortage areas by taking into account the health needs of the population. Moreover, it can inform the development of regional medical planning and resource allocation, thereby contributing to a more equitable and just society.
Keywords
Enhanced 2-Step Floating Catchment Area (E2SFCA); Access to primary care physicians; Pampalon Deprivation Index (PDI); Quebec province; Medical workforce
Introduction
Health services and their distribution in wealthy countries are based on the concept of equity. As such, there is a redistribution of various services offered by the state. In market-based healthcare systems, it is clear that the distribution of doctors is not socially optimal and contributes to territorial inequalities in access to care, representing a form of health inequality [1,2].
Primary care physicians are often in accessible in rural regions and among vulnerable populations such as low-income individuals and indigenous peoples [3]. These populations frequently lack private transportation, rendering them unable to access primary healthcare in the absence of a public transportation system, particularly in underserved areas. Lengthy travel times, limited transportation options and a dearth of healthcare professionals all present barriers in rural locations. Rural regions and vulnerable population centres are two areas where health disparities are most pronounced. These communities frequently encounter significant obstacles in accessing primary care providers. While the availability of health services does not ensure the overall health of the population, such services play a vital role in promoting and maintaining well-being by preventing disease, restoring health and function and contributing to the overall health of the population. Healthcare encompasses a continuum from prevention to treatment; however, without access to these services, their benefits cannot be realized and health inequalities are exacerbated. Efficient methods for identifying areas of need and equitably distributing resources are required by healthcare practitioners and policymakers to address these disparities.
One method to remove these obstacles and advance health equity is to increase access to primary care. The distribution of populations' access to primary care can differ with the needs of the population. The likelihood of experiencing hurdles to getting primary care is higher for people who live in rural areas, have poor incomes, or are members of marginalized groups. Healthcare policymakers and practitioners must address these discrepancies and create initiatives to increase vulnerable populations' access to primary care to advance health equity [4].
Unfortunately, many of the data that is used to assess primary care access is based on a dated and simple provider to population ratio, which has been demonstrated many times as an improper method [5]. In fact, this method embeds inequity and hides real access problems and should not be used [6]. Access measurements that are based on the Enhanced Two-Step Floating Catchment Area Method (E2SFCA) have been demonstrated as more sensitive to those problems and are considered the gold standard to measure access, particularly in rural areas that are less populated and often far away [7-10]. But this method could also be improved by incorporating the population needs of healthcare for each dissemination area. One tool that is currently used to represent population needs is the Pampalon Deprivation Index (PDI). The PDI can also be utilized in modifying access to primary care to meet the needs of vulnerable individuals in a better manner. In this section, this paper explores some of the applications of PDI in the modification of primary care access, especially among rural and vulnerable populations.
Pampalon deprivation index
The Pampalon Deprivation Index (PDI) is a tool that can be used to identify regions with high levels of material and social deprivation [11]. This index provides a valuable resource for policymakers and practitioners seeking to address health inequalities in rural and vulnerable populations. The PDI is a measure of social inequalities in health. It enables the monitoring of these inequalities over time, space and serves as a valuable tool for public health planning, intervention and service delivery [12]. By utilizing the index to identify areas with higher levels of deprivation, public health officials can target interventions and allocate resources more effectively. This can improve access to primary care in rural regions where it is most needed. The index provides a means for public health officials to identify and address health disparities in rural and vulnerable populations, helping to ensure that resources are allocated equitably and that interventions are targeted to those most in need.
The 2006 development of the PDI in Quebec, Canada, was based on several census characteristics, including income, education, employment and housing [11]. The index gives each local area or neighborhood a score; higher scores denote areas with greater deprivation. In Canada and other nations, the PDI has been widely used to identify needed areas and allocate resources. By allocating resources to places with the most need, the index has been demonstrated to be an effective tool for fostering health equity. Utilizing the PDI to address healthcare disparities has gained popularity recently, especially for vulnerable populations and rural areas.
The application of the PDI to promote equity, particularly for vulnerable groups and rural areas, and to rectify or adjust physical access to primary care physicians as a complement to access measure is explored in this paper. It will identify how the PDI can be used to pinpoint resource needs, identify areas of need, and inform the creation of policies and initiatives that address social determinants of health. The ultimate objective is to show how the PDI may support health equity and lessen health inequalities in underserved populations when used with the E2SFCA. Linking the E2SFCA with the PDI should provide an even better and sound index to measure primary care access by grouping the strength of the E2SFCA and the equity element of the DPI. Such an index does not exist in Quebec, even in the whole country at the time of this writing.
Due to lengthy travel times, a lack of accessible transportation and a paucity of medical professionals, primary care access gaps can be severe in rural areas. As the E2SFCA, the PDI can pinpoint regions where primary care access is especially poor and where more resources might be required to enhance access [4]. For instance, the PDI can be used to pinpoint locations with a rising population but few primary care doctors or those with high levels of material and social deprivation, both of which are linked to poor health outcomes. The PDI can also improve access to primary care by identifying areas with a shortage of primary care physicians or other healthcare professionals. The PDI can assist in developing policies and initiatives that motivate medical personnel to work in regions with significant economic and social suffering [4]. This can include loan payback plans, incentives, or tax advantages to entice healthcare professionals to work in underserved communities.
Research in Canada, for example, employed the PDI to identify locations with high levels of impoverishment and low levels of primary care availability [13]. According to the study, locations with higher PDI scores had fewer primary care physicians per capita than areas with lower PDI ratings. Based on their findings, the researchers suggested that primary care resources be directed toward locations with higher PDI scores to enhance access to care. The PDI tool can also enable policymakers to highlight better specific regions where intervention is needed most urgently. The tool, therefore, can be used as a credible reference for informing the development of interventions that improve access to primary healthcare in rural areas [12]. For example, the PDI can showcase areas where telehealth services could address access barriers and effectively deliver primary care to those in need. Similarly, information from the PDI can point towards mobile clinics or community health centres as another means to improve primary care accessibility.
In addition to remote areas, vulnerable groups like low-income persons and Indigenous peoples face major obstacles in getting access to primary care doctors [14]. The PDI can pinpoint regions with high concentrations of vulnerable individuals and pronounced gaps in primary care access. This can help guide the creation of policies and programs that allocate funding to certain regions and lower access hurdles. The PDI could be used to correct any type of access measure, even an administrative one like the most common regional availability measure, the Provider to Population Ratio (PPR), but such a method often hides access problems principally by not taking into account the distance and obstacles that the population needs to address to access healthcare. The most sensitive and appropriate methods to measure access in rural areas is the E2SFCA, and will be explored in the next section of this text.
E2SFCA method and the gravity model
Gravity models have been developed to address issues associated with regional availability measures and predict potential interaction between population location and available service points within a reasonable distance [15]. These models provide a measure that accounts for both proximity and availability [16]. As the distance between the provider and consumer increases, the number of interactions decreases, reducing the attractiveness of a service and increasing travel impedance. These techniques reveal greater spatial variation and eliminate issues associated with rigidly defined borders. The gravity model is considered the most reliable method for measuring spatial access as it takes into account decreased likelihood of access with increased distance from service sites.
The Floating Catchment Area (FCA) method uses circular buffers around census tract population centroids to compute a physician-to-population ratio based on the number of enclosed facilities. The radius of the buffer represents the catchment and reveals the distance individuals are willing to travel to access healthcare services. However, this assumption is flawed as a physician within the catchment may also serve residents outside of it. The 2SFCA method employs floating catchment areas rather than fixed boundaries, with the size determined by maximum travel impedance. A notable characteristic is that the sum of weighted mean values of GP ratios is equivalent to the supply and demand ratio in the larger study area.
Luo and Qi developed an enhancement to the 2SFCA method, incorporating a distance decay function into both algorithmic steps to address its limitations [17]. The Enhanced Two-Step Floating Catchment Area (E2SFCA) method offers several advantages over the original 2SFCA method, including the ability to differentiate accessibility within catchments and treat more distant providers as less accessible through the use of distance decay coefficients. By integrating the Physician Deprivation Index (PDI) into the E2SFCA methodology, a more equitable measure of access to healthcare services can be achieved through the characterization of the local environment. This novel methodology has the potential to improve healthcare planning and resource allocation, ultimately leading to improved health outcomes for the population.
Materials and Methods
The spatial distribution of primary care providers and population is a key factor in assessing the accessibility of health services. To quantify the spatial accessibility, we computed the distance between providers and population using geospatial data. We obtained the population data and location from the 2016 Canadian national census, which reported the information at the level of Dissemination Areas (DAs). DAs are the smallest standard geographic units that contain all census data and they had an average population of 496 and a size of 342 km2 in our study. We also used the PDI dataset to obtain the provider data and location.
We focused on the four easternmost territories of Quebec province, which are mainly rural except for some small urban centres that serve as administrative hubs. These are Saguenay, Rimouski, Gaspé, and Sept-Iles. The medical education for general practitioners is only available in Quebec city or farther, but some health professions can be trained in the two small universities in these regions. The students can also do some externships and residencies in these territories. The nursing education is more widely available with many colleges in smaller towns across Eastern Quebec.
We examined the four easternmost territories of Quebec province, which have different population sizes, densities and different numbers and distributions of General Practitioners (GPs). The territories are Côte-Nord, Gaspésie-Iles-De-La-Madeleine, Bas-Saint-Laurent, and Saguenay–Lac-Saint-Jean. The population, number of GPs, and GP-to-population ratio for each territory in 2016 as been shows in Table 1.
| Territory | Population | Number of GPs | GP-to-population ratio |
|---|---|---|---|
| Côte-Nord | 92,518 | 77 | 0.83 |
| Gaspésie–Îles-de-la-Madeleine | 92,403 | 131 | 1.45 |
| Bas-Saint-Laurent | 197,385 | 227 | 1.15 |
| Saguenay–Lac-Saint-Jean | 275,552 | 288 | 1.04 |
Table 1. Ratios of General Practitioners (GPs) per territory.
To measure the spatial accessibility of health services in these regions, we applied the Floating Catchment Area (FCA) method. This method uses circular buffers around census tract population centroids to compute a physician-to-population ratio from the number of enclosed facilities.
The FCA method assumes that the potential interaction between population location and all accessible service points within a reasonable distance decreases as the distance increases [15,17]. The FCA method can be expressed as follows:
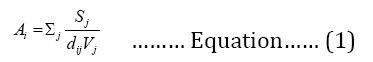
Where, A represents the sum of the spatial accessibility from population i, Sj is the number of general practitioners at location j, dij constitutes the travel time between i and j and V is the population demand defined as following:
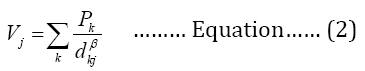
Where, Pk is population demand at location k, dkj is travel time between k and j while β is the distance decay (travel impedance) coefficient.
We used the Enhanced Two-Step Floating Catchment Area (E2SFCA) method to estimate the accessibility of healthcare services based on the travel distance of individuals [18]. This method improves the original FCA method by addressing the supply and demand issues and incorporating a distance-decay parameter [17,19]. We used the Network analysis module of Quantum Geographic Information System (QGIS) and the travel time Application Programming Interface (API) to determine the network routes and proximity within a predefined maximum catchment size [7-10]. The E2SFCA method calculates the population-to-provider ratios for each healthcare clinic and population centroid while accounting for distance friction. This method reflects the travel cost as a barrier to access, making the clinics farther away less accessible.
We also used the Pampalon Deprivation Index (PDI) as a corrective measure to adjust the access ratio calculated by the E2SFCA method. The PDI is a composite index of social and material deprivation for each Dissemination Area (DA) in the study area. We followed a similar approach as who used the Disability-Adjusted Life Year (DALY) values of the population to adjust the access ratio based on health needs [20]. However, their model is not directly applicable in Canada due to data and methodological differences. Therefore, we used the PDI to adjust the access ratio in a similar way. The adjustment factor ranges from 0.50 to 2.00, which means that the access ratio can be halved or doubled depending on the level of deprivation. A more deprived area will have a lower access ratio, indicating higher need, while a more advantaged area will have a higher access ratio, indicating lower need. The average PDI is considered as the baseline, which does not require any adjustment. We calculated the adjustment factor separately for the social and material components of the PDI.
We used the recommended range of 22.5 to 40.5 family physicians per 10 000 inhabitants as the benchmark for assessing the adequacy of access [21-25]. This range is quite wide, so we used it as the lower and upper limit to define three categories of access: Insufficient (below 22.5), adequate (between 22.5 and 40.5), and overprovisioned (above 40.5). These categories can show the level of access available to the population.
Results
We combined the Pampalon Deprivation Index (PDI) and the Enhanced Two-Step Floating Catchment Area (E2SFCA) method to estimate the equity in access to primary care. This approach provides a more comprehensive and equitable measure of accessibility than the E2SFCA method alone. Figure 1 shows the map of Quebec with the E2SFCA access ratio, while Figure 2 shows the map with the adjusted access ratio using the social DPI. The maps are similar at this resolution level. However, when we use the material DPI to adjust the access ratio (Figure 3), we can see some changes in different regions, especially when we zoom in on specific areas (Figures 1 and 2).

Figure 1. The E2SFCA method for four regions studied, with access levels of underserved, optimal and oversupplied. mmendation.

Figure 2. The E2SFCA method (E2SFCA-SDPI) adjusted with the social DPI for four regions studied, with access levels of underserved, optimal, and oversupplied.

We compared the access ratio maps with and without the material DPI adjustment to examine the impact of material deprivation on access to primary care. Figure 3 shows that the material DPI adjustment lowers the access ratio in Cote-Nord and Bas-Saint-Laurent regions, which are already underserved and deprived. On the other hand, the material DPI adjustment has little effect on Saguenay and Gaspesie regions, which have similar levels of access and deprivation. The social DPI adjustment does not change the access ratio significantly in any region, as shown in Figure 2. This may be because the social DPI values are average or good for these regions, while the material DPI values are below or average. These results suggest that material deprivation is a more important factor than social deprivation in affecting the accessibility of primary care in these regions, and that targeted interventions are needed to reduce the disparities in access (Figure 3).
We analyzed the changes in access levels in the CôteNord region after applying the material PDI adjustment (Figures 4 and 5).

Figure 3. The E2SFCA method (E2SFCA-MDPI) adjusted for the material DPI for four regions studied, with access levels of underserved, optimal and oversupplied.


Figure 4. The E2SFCA method for the côte-nord, bas-saint-laurent and gaspesie regions, with access levels of underserved, optimal, and oversupplied.


Figure 5. The E2SFCA-MDPI method for the Côte-Nord, Bas-Saint-Laurent and Gaspesie regions, with access levels of underserved, optimal and oversupplied.

We found that the material DPI adjustment increased the access level in Haute-rive area near Baie-Comeau, but decreased it in Forestville and Baie-Bomeau areas. In the Gaspesie region, we examined the changes in access levels in the Baie-Des-Chaleurs and Haute-Gaspesie sections (Figures 6 and 7).

Figure 6.The methods are explaining E2SFCA (left) and E2SFCA-MDPI (right) method for the Iles-de-la-Madeleine region, with access levels of underserved, optimal and oversupplied.


Figure 7. The methods are explaining E2SFCA (left) and E2SFCA-MDPI (right) method for the bas-saint-laurent region, with access levels of underserved, optimal, and oversupplied.

We found that the material PDI adjustment increased the access level in the area around Carleton, but decreased it in Miguasha, Bonaventure and Paspébiac areas. The access level remained unchanged in Ste-Anne-Des-Monts area. We also looked at the changes in access levels in the Iles-de-la-madeleine area (Figure 8). We found that the material DPI adjustment increased the access level in the southern part of the region, mainly Cap-aux-Meules and Havre-aux-Maisons area. We observed the most significant changes in access levels in the Bas-Saint-Laurent region after applying the material DPI adjustment. The material DPI adjustment increased the access level in many suburban areas near small towns such as Rivière-du-Loup, Rimouski and Matane (Figures 8-10). However, the material DPI adjustment decreased the access level in more rural areas (Figure 7). This decrease in access level affected some small villages and towns near larger towns, such as Degeli, Saint-Mathieu-de-Rioux and st. Gabriel. These results indicate that material deprivation is a major factor in reducing the accessibility of primary care services in these regions and that targeted interventions are needed to address the disparities in access.

Figure 8. The methods are explaining E2SFCA (left) and E2SFCA-MDPI (right) method for the rivière-du-loup region, with access levels of underserved, optimal, and oversupplied. 


Figure 9. The methods are explaining E2SFCA (left) and E2SFCA-MDPI (right) method for the Rimouski region, with access levels of underserved, optimal, and oversupplied.


Figure 10. The methods are explaing E2SFCA (left) and E2SFCA-MDPI (right) method for the Matane region, with access levels of underserved, optimal, and oversupplied. 

We analyzed the changes in access levels in the three largest towns in the Bas-Saint-Laurent region after applying the material DPI adjustment. We found that the material DPI adjustment had different effects on different areas within each town. Figure 8 shows that the material DPI adjustment decreased the access level in the downtown area of Rivière-du-Loup, but increased it in the new development area of St-Antonin. Figure 9 shows that the material DPI adjustment increased the access level in the areas along route 132 and highway 20 in Rimouski, including Montée des Saules, Bic and Saint-Anaclet. However, the material DPI adjustment decreased the access level in Montée Sainte-Odile, St-Robert and Arthur-Buie areas, as well as near the airfield, marina and seaport. Figure 10 shows that the material DPI adjustment increased the access level in the area near the Saint-Lawrence river and route 132 in Matane, including the Bon-Pasteur area. However, the material DPI adjustment decreased the access level in the downtown area and near the industrial park. These results suggest that material deprivation affects the accessibility of primary care services differently within each town, depending on the location and characteristics of each area (Figures 8-10).
We used the material Deprivation Index (DPI) to adjust the access ratio of primary care services calculated by the Enhanced Two-Step Floating Catchment Area (E2SFCA) method. We found that the material DPI adjustment had different effects on different regions of Quebec. The material DPI adjustment decreased the access ratio in Cote-Nord and Bas-Saint-Laurent regions, which are already underserved and deprived. The material DPI adjustment had little effect on Saguenay and Gaspesie regions, which have similar levels of access and deprivation. The social DPI adjustment did not change the access ratio significantly in any region. These results indicate that material deprivation is a more important factor than social deprivation in affecting the accessibility of primary care services in these regions, and that targeted interventions are needed to reduce the disparities in access.
We also analyzed the changes in access levels in the Bas-Saint-Laurent region after applying the material DPI adjustment. We found that the material DPI adjustment had different effects on different areas within the region. The material DPI adjustment increased the access level in many suburban areas near small towns such as Rivière-du-Loup, Rimouski and Matane. However, the material DPI adjustment decreased the access level in more rural areas and some small villages and towns near larger towns, such as Degeli, st-Mathieu-de-Rioux, and st-Gabriel. We further examined the changes in access levels in the three largest towns in the Bas-Saint-Laurent region: Rivière-du-Loup, Rimouski and Matane. We found that the material DPI adjustment had different effects on different areas within each town, depending on the location and characteristics of each area. Some areas experienced an increase in accessibility while others experienced a decline. These results suggest that material deprivation affects the accessibility of primary care services differently within each town and area, and that more nuanced interventions are needed to address the variations in access [26-35].
Discussion
We estimated the equity in access to primary care services using the Enhanced Two-Step Floating Catchment Area (E2SFCA) method with the Pampalon Deprivation Index (PDI) adjustment. This method accounts for both the supply and demand of healthcare services, and adjusts the access ratio based on the material and social deprivation of each area. The PDI is a composite measure of material and social deprivation, which can help to identify vulnerable populations who may face barriers to accessing healthcare services. By integrating the PDI into the E2SFCA method, we can improve the accuracy and equity of the accessibility measure. This method can help to identify and address disparities in access to primary care services, especially among vulnerable populations. By using this method, policymakers and healthcare providers can better target interventions and allocate resources to improve access to primary care for those who need it most.
In this paper, we applied the PDI adjustment to the E2SFCA method to measure the spatial accessibility of primary care physicians in Quebec, focusing on vulnerable groups and rural areas. We found that the material DPI adjustment had a significant impact on access to primary care services in various regions of Quebec, while the social DPI adjustment had no discernible effect. We also found that the material DPI adjustment had different effects on different areas within each region, depending on the location and characteristics of each area. We analyzed the changes in access levels in Cote-Nord, Gaspesie, and Bas-Saint-Laurent regions, as well as in the three largest towns in Bas-Saint-Laurent region: Rivière-du-Loup, Rimouski and Matane. We discussed how these results can inform public health interventions that address the social determinants of health, such as housing, education, income and employment, which can affect access to primary healthcare and health outcomes. This paper contributes to the literature on the use of the E2SFCA-PDI method to assess and improve equity in access to primary care services.
Conclusion
We proposed a new method to estimate the equity in access to primary care physicians using the Enhanced Two-Step Floating Catchment Area (E2SFCA) method with the Pampalon Deprivation Index (PDI) adjustment. This method can help policymakers to identify regions that have low access to primary care doctors and design targeted interventions to improve access. This method can also inform the development of policies and programs that address the social determinants of health, which can affect access to primary healthcare and health outcomes for vulnerable populations. By integrating the PDI into the E2SFCA method, we can provide a more accurate and equitable measure of accessibility than the E2SFCA method alone. This method is a valuable tool for promoting equity in healthcare and improving the health and well-being of our communities.
References
- Mougeot M, Naegelen F. Achieving a fair geographical distribution of health-care resources. Reg Sci Urban Econ 2018;70:384-392.
- Alfano N, Bertolucci M, Jonsson AS, Tiberghien B. Access to healthcare services in medical wastelands: The “first-aid line” as a tension absorber? The case of the french fire departments. Gestion et management public 2018;6(3):51-69.
- Muhammed KA, Umeh KN, Nasir SM, Suleiman IH. Understanding the barriers to the utilization of primary health care in a low-income setting: Implications for health policy and planning. J Public Health Afr 2013;4(2):e13.
[Crossref] [Google Scholar] [PubMed]
- Pampalon R, Hamel D, Gamache P, Philibert MD, Raymond G, Simpson A. An area-based material and social deprivation index for public health in Québec and Canada. Can J Public Health 2012;103(8):S17-S22.
[Google Scholar] [PubMed]
- McGrail MR, Humphreys JS. A new index of access to primary care services in rural areas. Aust N Z J Public Health 2009;33(5):418-423.
[Crossref] [Google Scholar] [PubMed]
- Neutens T. Accessibility, equity and health care: review and research directions for transport geographers. J Transp Geogr 2015;43:14-27.
- Amiri S, Espenschied JR, Roll JM, Amram O. Access to primary care physicians and mortality in Washington state: Application of a 2‐step floating catchment area. J Rural Health 2020;36(3):292-299.
[Crossref] [Google Scholar] [PubMed]
- Crooks VA, Schuurman N. Interpreting the results of a modified gravity model: Examining access to primary health care physicians in five Canadian provinces and territories. BMC Health Serv Res 2012;12(1):1-3.
[Crossref] [Google Scholar] [PubMed]
- McGrail MR. Spatial accessibility of primary health care utilising the two step floating catchment area method: An assessment of recent improvements. Int J Health Geogr 2012;11(1):1-2.
[Crossref] [Google Scholar] [PubMed]
- Wan N, Zhan FB, Zou B, Chow E. A relative spatial access assessment approach for analyzing potential spatial access to colorectal cancer services in Texas. Appl Geogr 2012;32(2):291-299.
- Pampalon R, Hamel D, Gamache P, Simpson A, Philibert MD. Validation of a deprivation index for public health: A complex exercise illustrated by the Quebec index. Chronic Dis Inj Can 2014;34(1):12-22.
[Crossref] [Google Scholar] [PubMed]
- Pampalon R, Hamel D, Gamache P, Raymond G. A deprivation index for health planning in Canada. Chronic Dis Can 2009;29(4):178-191.
[Crossref] [Google Scholar] [PubMed]
- Blair A, Gariépy G, Schmitz N. The longitudinal effects of neighbourhood social and material deprivation change on psychological distress in urban, community-dwelling Canadian adults. Public Health 2015;129(7):932-940.
[Crossref] [Google Scholar] [PubMed]
- Khakh AK, Fast V, Shahid R. Spatial accessibility to primary healthcare services by multimodal means of travel: Synthesis and case study in the city of Calgary. Int J Environ Res Public Health 2019;16(2):170.
[Crossref] [Google Scholar] [PubMed]
- Guagliardo MF. Spatial accessibility of primary care: Concepts, methods and challenges. Int J Health Geogr 2004;3(1):1-3.
[Google Scholar] [PubMed]
- Joseph AE, Phillips DR. Accessibility and utilization: Geographical perspectives on health care delivery. Harper and Row, London, 1984.
- Luo W, Qi Y. An Enhanced Two-Step Floating Catchment Area (E2SFCA) method for measuring spatial accessibility to primary care physicians. Health Place 2009;15(4):1100-1107.
[Crossref] [Google Scholar] [PubMed]
- Paez A, Higgins CD, Vivona SF. Demand and level of service inflation in Floating Catchment Area (FCA) methods. PLoS One 2019;14(6):e0218773.
[Crossref] [Google Scholar] [PubMed]
- Luo W, Wang F. Measures of spatial accessibility to health care in a GIS environment: Synthesis and a case study in the Chicago region. Environ Plann B Plann Des 2003;30(6):865-884.
[Crossref] [Google Scholar] [PubMed]
- COGME 1995 Physician Workforce Funding Recommendations for Department of Health and Human Services’ Programs, Seventh Report. Educational Resources Information Center 1995.
- Cooper RA, Getzen TE, McKee HJ, Laud P. Economic and demographic trends signal an impending physician shortage. Health Aff 2002;21(1):140-154.
[Crossref] [Google Scholar] [PubMed]
- Dall T, West T, Chakrabarti R, Iacobucc W. The complexities of physician supply and demand: Projections through 2025. Assoc of Am Med Coll 2015.
- McNutt DR. GMENAC: It’s manpower forecasting framework. Am J Public Health 1981;71(10):1116-1124.
[Crossref] [Google Scholar] [PubMed]
- Hicks LL, Glenn JK. Rural populations and rural physicians: Estimates of critical mass ratios, by specialty. J Rural Health 1991;7(4):357-371.
[Crossref] [Google Scholar] [PubMed]
- Markit I. The complexities of physician supply and demand: Projections from 2019 to 2034. Assoc Amer Med Coll 2021:1-104.
- Arcury TA, Gesler WM, Preisser JS, Sherman J, Spencer J, Perin J. The effects of geography and spatial behavior on health care utilization among the residents of a rural region. Health Serv Res 2005;40(1):135-156.
[Crossref] [Google Scholar] [PubMed]
- Bauer J, Klingelhöfer D, Maier W, Schwettmann L, Groneberg DA. Prediction of hospital visits for the general inpatient care using floating catchment area methods: A reconceptualization of spatial accessibility. Int J Health Geogr 2020;19(1):1-29.
[Crossref] [Google Scholar] [PubMed]
- Bentham G, Haynes R. Health, personal mobility and the use of health services in rural Norfolk. J Rural Stud 1985;1(3):231-239.
- Chan E, Serrano J, Chen L, Stieb DM, Jerrett M, Osornio-Vargas A. Development of a Canadian socioeconomic status index for the study of health outcomes related to environmental pollution. BMC Public Health 2015;15(1):1-8.
[Crossref] [Google Scholar] [PubMed]
- Fone DL, Christie S, Lester N. Comparison of perceived and modelled geographical access to accident and emergency departments: A cross-sectional analysis from the Caerphilly health and social needs study. Int J Health Geogr 2006;5:1-10.
[Crossref] [Google Scholar] [PubMed]
- Girard JP. Our health system differently: Citizen engagement through cooperatives. Éditions BLG, 2006.
- Higgs G, Zahnow R, Corcoran J, Langford M, Fry R. Modelling spatial access to general practitioner surgeries: Does public transport availability matter? J Transp Health 2017;6:143-154.
- Pagano E, di Cuonzo D, Bona C, Baldi I, Gabriele P, Ricardi U, et al. Accessibility as a major determinant of radiotherapy underutilization: A population based study. Health Policy 2007;80(3):483-491.
[Crossref] [Google Scholar] [PubMed]
- Schuurman N, Berube M, Crooks VA. Measuring potential spatial access to primary health care physicians using a modified gravity model. Can Geogr 2010;54(1):29-45.
- Starfield B. Measurement of outcome: A proposed scheme. Milbank Quart 1974;52(1):39-50.
[Crossref] [Google Scholar] [PubMed]